

A while back I wrote about reading location data from a QR code using the QR code generator on Denso Wave’s official site. When I scanned a QR code, the position came back as latitude and longitude instead of a regular street address.
記事を取得できませんでした。記事IDをご確認ください。
Here is the location file I downloaded as a CSV at the time.

Using this as a starting point, let me show you Excel’s 3D Maps feature, which lets you plot latitude and longitude on a map all at once (*´▽`*)
📋 What you’ll learn in this article
- How to visualize latitude and longitude data on a map with Excel’s 3D Maps
- How to convert a CSV file to xlsx so 3D Maps will actually work
- How to set latitude and longitude for a location field
- Bonus: turning the map into an image or video for presentations
Using Excel’s 3D Maps to plot GPS coordinates on a map
⚠️ A quick note on versions
3D Maps is available in Excel 2016 and later, including Microsoft 365. It will not work while the file is still in CSV format. As mentioned at the very start of this article, save it as xlsx before you begin.
The same approach works for other apps and location-data formats too.
A map view makes it obvious at a glance where most of your access is coming from, so it is genuinely useful for this kind of analysis.
The file above was really just a test, so for this walkthrough I wanted a few more sample locations with latitude and longitude to work with.
I added a few extra rows using data from here:
Save the file as xlsx so 3D Maps will work
Since 3D Maps does not work with a plain CSV file, save it in xlsx format first.
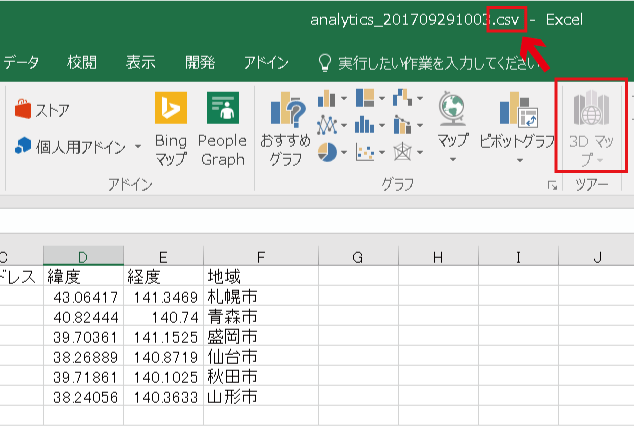
Give it a name and save it wherever is convenient — your desktop is fine — just make sure it is in xlsx format.

Once it is saved as xlsx, the 3D Maps option under the Insert tab becomes available.
Select the field you want to show on the map, then open 3D Maps
Here I am simply selecting the latitude and longitude columns, since all I want for now is to see where things are on a map.
One thing worth noting: since selecting these columns alone determines the location pin, you will end up selecting several regions at once too.
If you need to select rows or columns that are not next to each other, hold the Ctrl key while selecting.
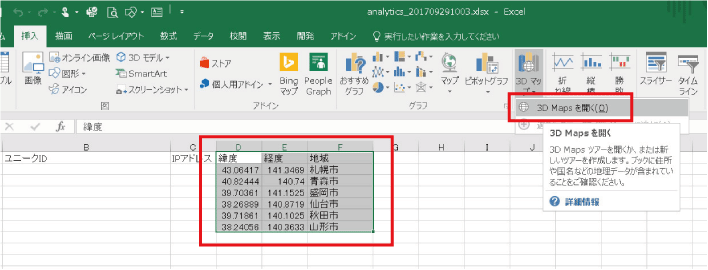
That brings the data into 3D Maps.
Choosing fields inside 3D Maps
From here, all that is left is to assign each column to the right field.
Since I want to show locations by latitude and longitude this time, I will assign longitude to the location field first.
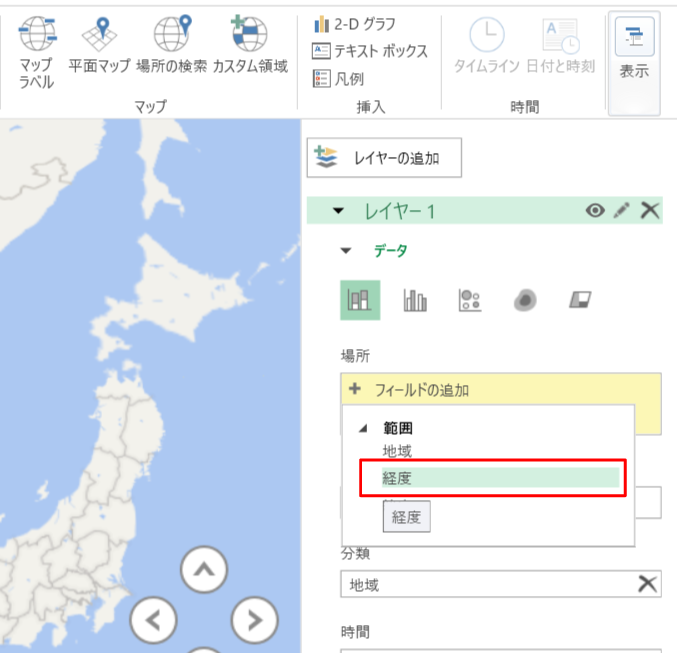
Whether you start with longitude or latitude does not matter — once both are entered, the location appears on the map — so go ahead and assign latitude next.
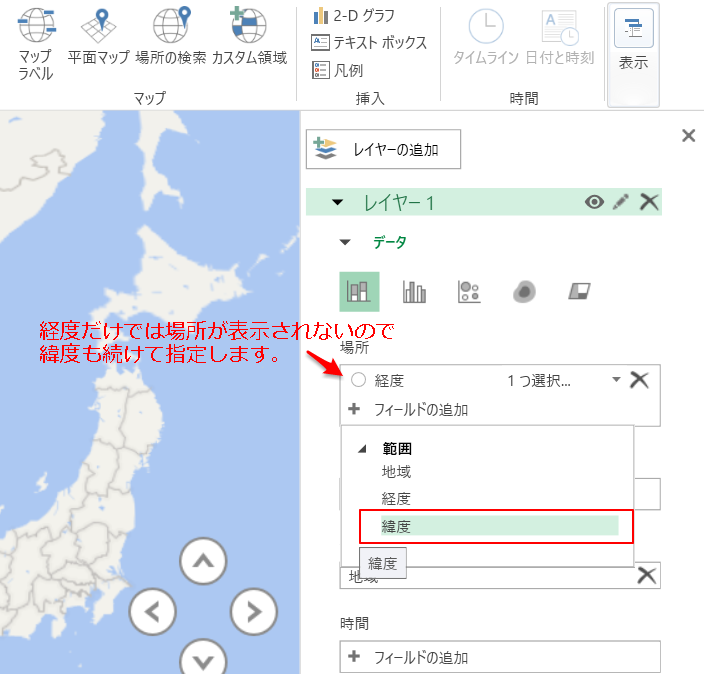
That completes the location field setup.
Next, tell Excel which of your data columns maps to which value.
Longitude goes to longitude, latitude goes to latitude.
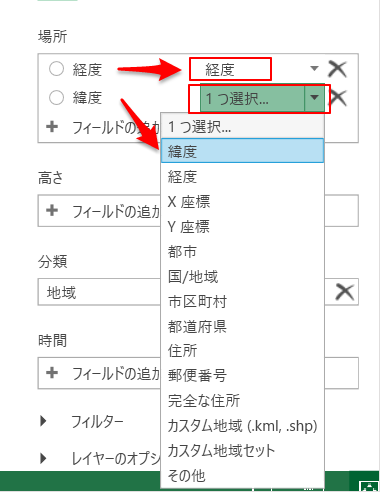
That finishes the setup needed to display locations from latitude and longitude data.
The locations show up clearly on the 3D Map
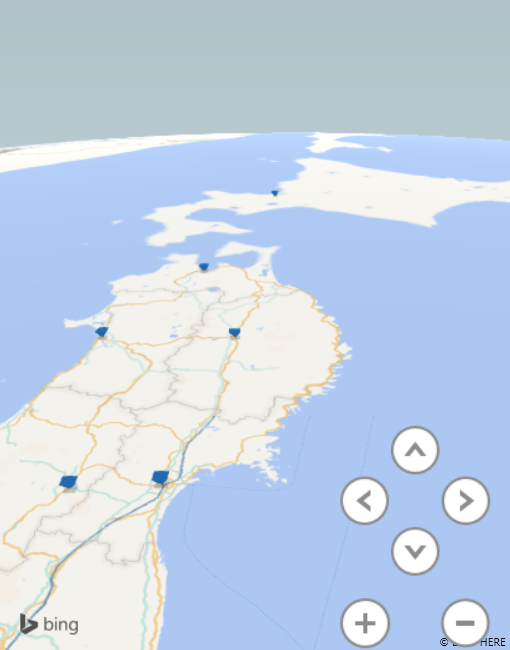
Here is where the latitude and longitude locations ended up.

But… this does not really look like much of a map yet, does it (*´Д`)
3D Maps is supposed to be a bit more impressive than this, right
The good news is that this map is genuinely 3D, so you can move it around freely with your cursor.

Tilting it downward a little and zooming in — either with your mouse wheel or the Shift and plus keys — makes it much easier to read.
You can even turn your 3D Map into an image or video for effective presentation materials
That is how you can display locations on a map using latitude and longitude data.
It is an easy way to show where a scanned QR code was located, for example, if you want to include that in a presentation about marketing results.
Take it a step further, and you can even turn the map into a video, which makes for a more polished visual with very little extra effort, and it is easier to read too.
This one is a genuinely great time-saving trick.
If this helps even one other productivity-minded person out there, I will be glad.
✅ Today’s recap
- ☐ Re-saved the CSV file in xlsx format
- ☐ Loaded the latitude and longitude data into Excel
- ☐ Insert tab → opened 3D Maps
- ☐ Set Latitude and Longitude on the location field
- ☐ The locations appeared as pins on the map
- ☐ (Bonus) Exported the 3D Map as an image or video for presentation use
I have also written about a quick trick for creating a batch of folders at once, so have a look at that too if it sounds useful.

☕ Enjoyed this post?
I'm a Japanese blogger who spent 8 years relearning English from scratch.
If this post helped you, a coffee would mean a lot — thank you for reading!



https://www.benricho.org/chimei/latlng_data.html
This Japanese reference site lets you download the latitude and longitude of every Japanese prefectural government office as an xls file — handy if you just want some quick, real sample data to test with.